Inventory Growth and Market Balance
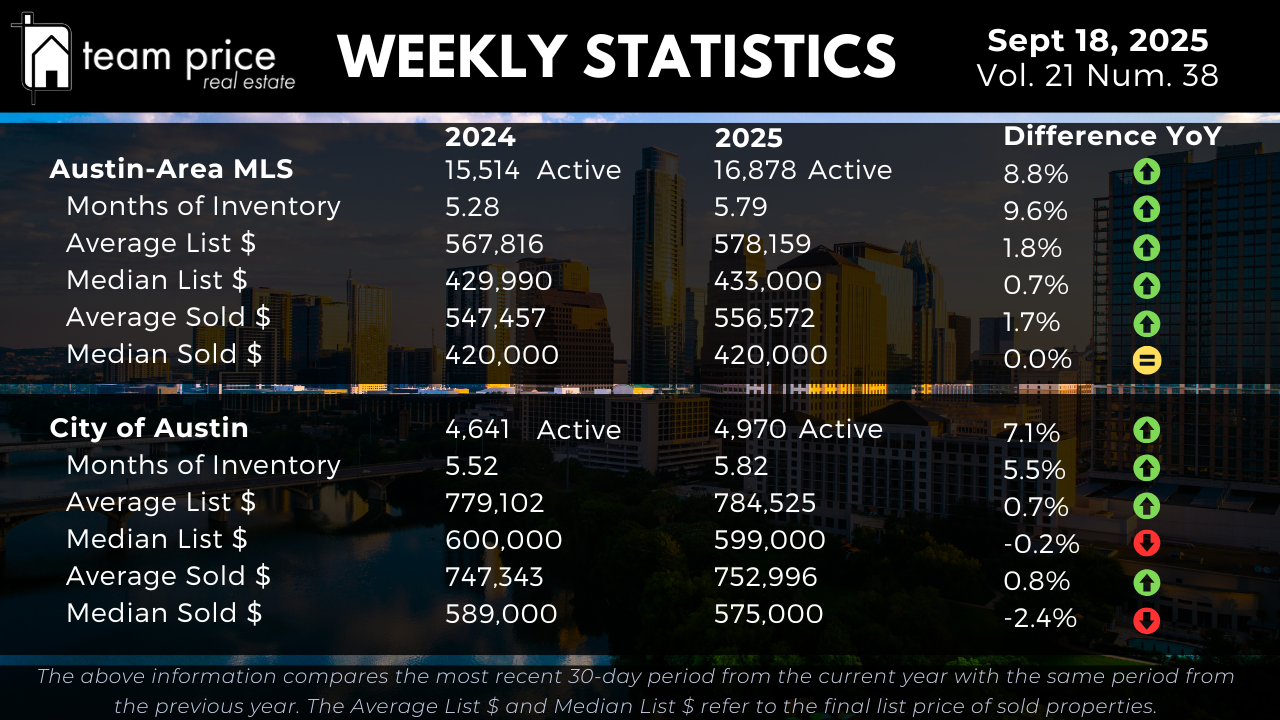
Active residential listings across the Austin-Area MLS reached 16,878 in mid-September 2025, an 8.8 percent increase from 15,514 one year ago. Compared to last week’s 16,954 listings, inventory has edged down slightly, but the overall trend remains higher year over year. Months of Inventory also rose from 5.28 last year to 5.79 today, a 9.6 percent gain that points to slower absorption of available homes.
Inside the City of Austin, the pattern is similar though somewhat more restrained. Active listings climbed 7.1 percent year over year, increasing from 4,641 in 2024 to 4,970 this year. Months of Inventory expanded from 5.52 to 5.82, a 5.5 percent rise. These figures confirm that buyers now have more options than they did a year ago, and the pace of sales relative to supply is slower than last September.
Pricing Stability Across the MLS
Pricing trends across the Austin-Area MLS remain largely stable. The average list price for active homes rose 1.8 percent, from $567,816 in 2024 to $578,159 in 2025. The median list price increased 0.7 percent, moving from $429,990 to $433,000. On the sales side, the average sold price improved 1.7 percent year over year, from $547,457 to $556,572. The median sold price showed no change, holding at $420,000.
Compared to last week, both list and sold prices have shifted very little, highlighting a market where values are relatively flat. This combination of higher inventory and steady pricing continues to signal a balancing environment rather than one dominated by rapid appreciation or steep declines.
Pricing Trends in the City of Austin
Within the City of Austin, pricing movement has been mixed. The average list price rose 0.7 percent, increasing from $779,102 to $784,525. The median list price dipped slightly by 0.2 percent, from $600,000 to $599,000. Closed sales echoed this restrained trend. The average sold price rose 0.8 percent year over year, from $747,343 to $752,996. The median sold price, however, declined 2.4 percent, dropping from $589,000 to $575,000.
On a week-over-week basis, the median sold price in Austin is down from last week’s $590,000, underscoring that pricing remains under modest pressure in the city’s core.
Negotiation and Buyer Leverage
Negotiation continues to be a defining feature of the current market. So far this month, 69.26 percent of closed sales in the Austin-Area MLS have transacted below list price. This is up from 65.95 percent last month, confirming that more buyers are securing discounts relative to asking prices. At the same time, 18.33 percent of homes have sold at list price, down from 21.86 percent in August. Roughly 12.41 percent of sales have closed above asking, nearly unchanged from last month’s 12.19 percent but below July 2024’s 13.24 percent.
The average sold-to-list price ratio now stands at 96.7 percent, further illustrating that sellers are accepting offers under asking in most transactions.
Regional and ZIP Code Variations
Conditions across Central Texas remain highly localized. Among the 30 tracked cities, 13 (43 percent) posted month-over-month price increases, while 17 (57 percent) recorded declines. On a year-over-year basis, only 8 cities (27 percent) saw gains, while 22 (73 percent) registered losses. None of the tracked cities are above their 12-month peak, underscoring the broad nature of the regional correction.
At the ZIP code level, 29 out of 75 tracked areas (39 percent) reported month-over-month increases, while 44 (59 percent) showed declines. Year over year, 23 ZIP codes (31 percent) posted gains, while 52 (69 percent) saw decreases. Only one ZIP code in the region is currently above its 12-month peak, leaving 74 still below.
Prices Relative to Peak Levels
Prices across both the Austin-Area MLS and the City of Austin remain meaningfully below peak values from 2022 and 2023. In the MLS as a whole, the average list price is down 12.1 percent from its March 2023 high, while the median list price is 14.9 percent below the May 2022 peak. The average sold price has fallen 16.1 percent from May 2022, and the median sold price is down 21.0 percent. On a price-per-square-foot basis, current values are 22 to 24 percent lower than peak.
Within the City of Austin, the story is similar. The average sold price is 14.5 percent below its May 2022 high, while the median sold price has dropped 18.4 percent. On a price-per-square-foot basis, Austin homes are trading 23 to 27 percent below their 2022 peak levels. The only category to reach a new high this year is the city’s average list price, which set a fresh record at $989,635 in September 2025.
Market Outlook
The Austin housing market as of September 18, 2025 reflects a transition into balance. Inventory levels are higher than both last year and last month, absorption has slowed, and most sales are closing below list price. Year-over-year pricing is stable in the MLS overall, but the City of Austin is seeing some softening, particularly in its median sold price. Compared to the highs of 2022 and 2023, values remain considerably lower, suggesting buyers still have room to negotiate while sellers must remain realistic in their pricing strategies.
For buyers, the current conditions provide more inventory, slower competition, and leverage in negotiations. For sellers, success depends on accurate pricing and flexibility in contract terms. For investors, the message is clear: the days of double-digit appreciation are behind us for now, but today’s market offers opportunities for disciplined acquisitions in a more predictable environment.